Federal Reserve Chairman Jay Powell reiterated his warning that getting inflation under control will require some pain. Powell is likely making these warnings based on the arcane, clunky relationship between inflation and unemployment. The key to getting the market back into balance is a bigger labor force, and the economy is starting to experience a larger labor force as individuals come off the sidelines and rejoin the job market
“PAINFUL” RISE IN UNEMPLOYMENT?
Members of the Federal Open Market Committee (FOMC) recently issued warnings that the path to lower inflation will be painful. The crux of that view is based on the arcane, clunky Phillips Curve, which illustrates the relationship between inflation and unemployment. Like many concepts in global markets, the Phillips Curve went through many iterations and has plenty of versions. Nonetheless, the FOMC believes that the basic Phillips Curve concept is paramount for this current environment; i.e., the economy cannot get back to a long-run 2% inflation rate unless unemployment rises. And a future rise in unemployment could be significant and pain-provoking, especially for lower income households.
IS CURRENT INFLATION DRIVEN BY A TIGHT LABOR MARKET?
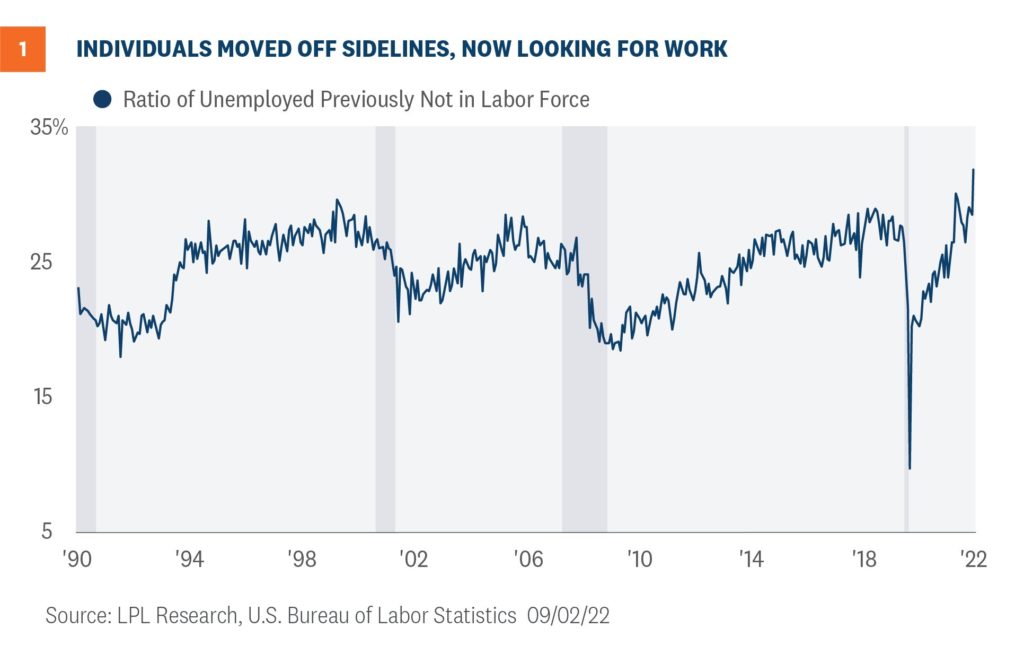
The global economy is complex, and a simplification of reality always introduces distortions, so perhaps we should zoom out a bit. The world experienced multiple industrial revolutions, from mechanical to electrical to digital, and some talk about a fourth industrial revolution. Wherever the world is in its revolutionary phase, most agree that inflationary contributors change over time. And sometimes that change can happen quickly. We believe current inflation is a result of large fiscal stimulus during the COVID-19 shutdowns and nagging supply bottlenecks, further aggravated by a host of potential workers who are still on the sidelines. The latest jobs report gave some glimmer of hope. Over a third of those unemployed and looking for work were previously not in the labor force as shown in Figure 1. As more
individuals reenter the workforce, the labor market could loosen organically, especially as individuals currently not in the labor force move directly into a job.

PEOPLE ARE GENERALLY FULLY EMPLOYED
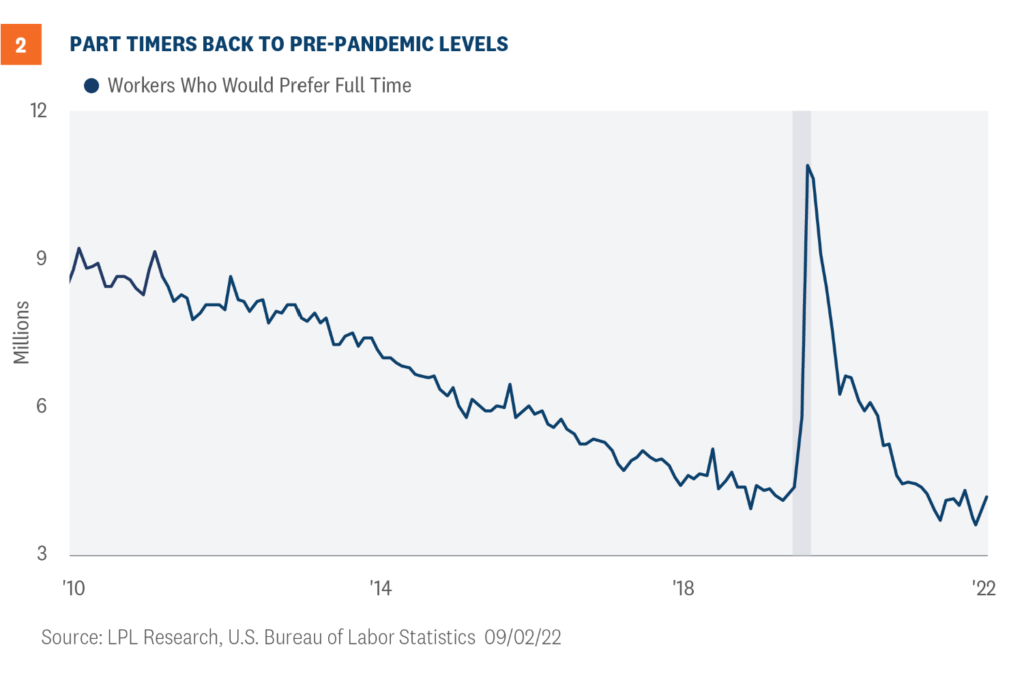
There are many nuances within the labor market. Some metrics reverted to pre-pandemic levels while others are still making new records, including the share of unemployed individuals who just reentered the workforce. Since job openings remain elevated, those who wish to work full time are doing so as shown in Figure 2. Since last year, the number of part timers who would prefer a full time job is steadily declining. Therefore, most of those looking for full time work get what they want.

CAUTIONARY TALES TOLD BY HIGH TEMP HELP SERVICES
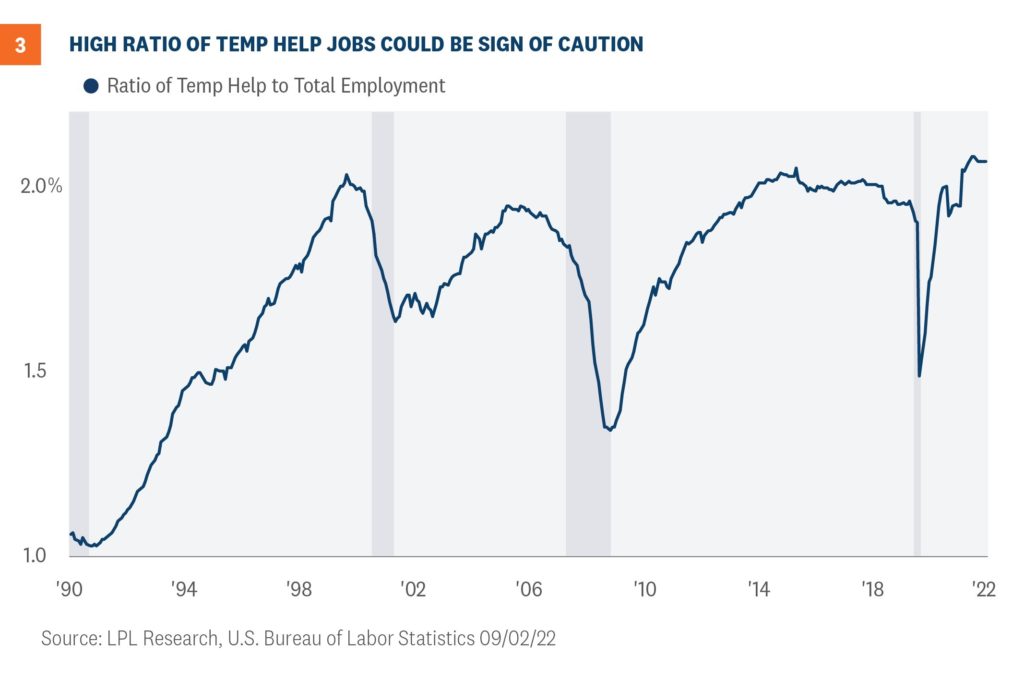
The temporary help services industry tends to be a leading indicator for aggregate employment trends in the U.S. During emerging periods of expansion, temp help workers tend to be the first hired because of the relatively low cost to employers for benefits and training. Likewise, during periods of economic slowdown, temporary workers are typically the first to get the notorious pink slip. In August, the economy has the highest ratio of temporary help workers since the data series began in the early 1990s [Figure 3]. Perhaps this could become one area of potential pain.

CONCLUSION
The inflation fight will be slow and painful, but will the pain be as acute as some suggest? We think the decline in the Consumer Price Index (CPI) from 9% to 6% will be much easier than the drop from 6% to sub-3%, partially because base effects will play a larger role and supply chains are improving. And at the core, we expect to see more people come off the sidelines and directly reenter the workforce, loosening the labor market without a significant spike in unemployment. One risk is the high number of workers in temporary help services since these jobs often are the first to go during times of economic uncertainty. Another risk is a Federal Reserve (Fed) who may not have the luxury to wait and see how the front-loaded rates hikes earlier this year will affect the real economy. For now, the Fed will be committed to additional front-loaded rate hikes, increasing the risks of recession next year.
IMPORTANT DISCLOSURES
This material is for general information only and is not intended to provide specific advice or recommendations for any individual. There is no assurance that the view s or strategies discussed are suitable for all investors or w ill yield positive outcomes. Investing involves risks including possible loss of principal. Any economic forecasts set forth may not develop as predicted and are subject to change.
References to markets, asset classes, and sectors are generally regarding the corresponding market index. Indexes are unmanaged statistical composites and cannot be invested into directly. Index performance is not indicative of the performance of any investment and does not reflect fees, expenses, or sales charges. All performance referenced is historical and is no guarantee of future results.
Any company names noted herein are for educational purposes only and not an indication of trading intent or a solicitation of their products or services. LPL Financial doesn’t provide research on individual equities.
All information is believed to be from reliable sources; how ever, LPL Financial makes no representation as to its completeness or accuracy.
The Standard & Poor’s 500 Index (S&P500) is a capitalization-w eighted index of 500 stocks designed to measure performance of the broad domestic economy through changes in the aggregate market value of 500 stocks representing all major industries.
The PE ratio (price-to-earnings ratio) is a measure of the price paid for a share relative to the annual net income or profit earned by the firm per share. It is a financial ratio used for valuation: a higher PE ratio means that investors are paying more for each unit of net income, so the stock is more expensive compared to one w ith low er PE ratio.
Earnings per share (EPS) is the portion of a company’s profit allocated to each outstanding share of common stock. EPS serves as an indicator of a company’s profitability. Earnings per share is generally considered to be the single most important variable in determining a share’s price. It is also a major component used to calculate the price-to-earnings valuation ratio.
All index data from FactSet.
This research material has been prepared by LPL Financial LLC.
Securities and adv isory servicesoffered through LPL Financial (LPL), a registered inv estment advisor and broker-dealer (member FINRA/SIPC). Insurance products are offered through LPL or its licensed affiliates. To the extent you are receiving investment advice from a separately registered independent investment advisor that is not an LPL affiliate, please note LPL makes no representation with respect to
such entity.
Not Insured by FDIC/NCUA or Any Other Gov ernment Agency Not Bank/Credit Union Guaranteed
Not Bank/Credit Union Deposits or Obligations May Lose Value
RES-1263850-0922 | For Public Use | Tracking # 1-05325027 (Exp. 09/2023)

