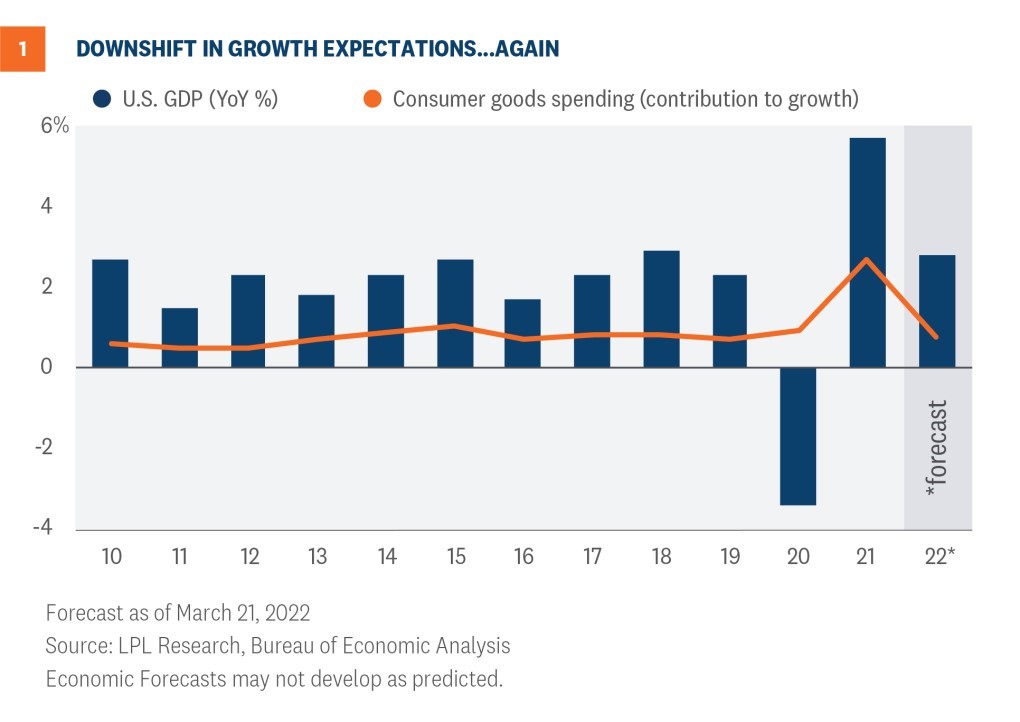
LPL Research reduced U.S. and global GDP forecasts due to Russian commodity disruptions, elevated inflation dynamics, and higher borrowing costs. Still, we expect the U.S. economy to grow 2.7-3.2% in 2022, supported by business investment and consumer services spending in the latter half of this year. Forecasts for GDP growth in developed economies excluding the U.S. and emerging markets were also reduced this month to 2.5–3% and 3.8–4.3% respectively, bringing the LPL Research global GDP growth forecast down about one percentage point to 3–3.5%.
TALE OF TWO HALVES
This year, many aspects of the economy will likely be told as tales of two halves. Economic
growth during the first half of this year will likely be different than the second half. Moreover,
inflation pressures affect the lower half of the consumer base differently than the upper half. As
the country adjusts to pandemic reshuffling and rising mortgage rates, we will likely observe
greater regional and demographic divergence within the housing market.
Overall, the first half of this year will likely drag on 2022 U.S. economic growth while the
second half of the year could rebound if global conditions improve. We started this year with a
variant strain of COVID-19, and consumers and businesses alike pulled back spending. Before
the economy could recover, geopolitical tensions snapped from Russia’s decision to invade
Ukraine. Commodity prices rose to record levels, some markets temporarily closed, and fixed
income markets responded to a new paradigm.
Globally-coordinated sanctions will impact markets for as long as Russia’s war remains.
Because of geopolitical conflict and persistent inflation pressures, we revised our U.S. GDP
forecast again in March after a downward revision in February. We now expect the U.S. to
grow 2.7–3.2% in 2022, as noted in our latest Global Portfolio Strategy report. Last year, as
the economy rebounded from the lockdowns; consumers concentrated spending on goods
versus services, which translated into an outsized contribution to growth [Figure 1].

As consumers pivot to services spending, the 2022 growth estimate will have support from a
rebound in services spending in addition to strong business investment. Consumers likely have
pent up demand for services foregone since March 2020. If spending patterns revert to trends,
the economy will have $500 billion added to the consumer services component of GDP
[Figure 2]. The forecast is also predicated on wage growth from a tight labor market and
households flush with cash.

CONSUMER CONFIDENCE IMPLIES WEAKNESS, NOT NECESSARILY RECESSION
Recent consumer surveys point to weakness for the first half of this year but a rebound in the
second half is still possible. Both Conference Board and University of Michigan surveys reveal
a burden on consumers, particularly from pricing pressures. Surprisingly, buying plans within
the next six months for big-ticket items such as cars and houses are at or above trend. The
headline Consumer Confidence Index is lower than recent months, but a decline in consumer
confidence does not always foreshadow an imminent recession [Figure 3]. The Index fell in
the mid-1980s and throughout the 1990s, and recessions did not immediately follow. On the
contrary, during the late 1980s, consumer confidence steadily rose after the low point in
January 1987. Even though recession risks are rising, the LPL Research base case scenario is
no recession in the U.S. this year, assuming the Federal Reserve (Fed) does not overtighten
and supply constraints ease, to list just a few risks to growth. The weak survey in January and
February is consistent with the overall narrative that first quarter GDP growth will be very low,
but if inflation pressures subside and the labor market remains solid, GDP growth should
recover in the latter half of the year.

HIGHER EXPECTED TREASURY YIELDS
Core bonds (as measured by the Bloomberg Aggregate index) have had the worst start to the
year since the 1980s due to a significant repricing of Fed rate hike expectations. At the end of
September 2021, markets were expecting only one 25 basis point (0.25%) rate hike this year,
but markets are now expecting the Fed to hike short-term interest rates by 250 basis points
(2.50%). This has caused U.S. Treasury yields, across the curve, to move meaningfully higher
this year. At 2.60% (as of 4/07/22), the 10-year Treasury yield has already increased by over
1.1% this year and by over 2% from the August 2020 low of 0.50%.4 Member FINRA/SIPC
As markets are forward-looking, this move higher in yields due to expected interest rate hikes
is consistent with past rate hiking campaigns and suggest we may be near the peak in yields
for this cycle. In each of the last three Fed rate hiking campaigns for example, the 10-year
Treasury yield moved more ahead of the hikes than during the hikes. The fed funds rate was
raised by 175 basis points, 425 basis points, and 225 basis points each of last three cycles
while the 10-year Treasury yield moved higher by just 62 basis points, 60 basis points, and 47
basis points, respectively.
So that said, as inflationary pressures have broadened this year, and with the Fed likely forced
to tighten monetary policy quicker than we originally expected, we now expect the 10-year
Treasury yield to end the year between 2.25% and 2.50% with risks to the upside. As this is a
yearend target, there is a high likelihood that yields could get as high as 2.75%-3.00% in the
near term, depending on the path of inflation over the summer months. If inflationary pressures
remain stubbornly high, forcing the Fed to follow through with rate hike expectations, yields
could continue to climb marginally higher, which is consistent with history. However, if
inflationary pressures fade over the course of the year, potentially resulting in a less
aggressive rate hiking campaign, it’s likely that yields could move back down to around current
levels, which is our expectation.
An additional consideration, though, is if the Fed is forced to hike rates more aggressively than
markets are expecting, there is a possibility that recessionary risks are pulled forward into
2023, which could cause interest rates to move lower than current levels. Given the three
potential scenarios, we think the biggest move higher in yields has likely already happened but
we do think elevated levels of volatility are likely to remain.
CONCLUSION
Due to a confluence of factors, we expect slower economic growth in the U.S. and globally.
Fully functioning supply chains, restored relationships in Eastern Europe, and improving
inflation metrics are all key factors for our baseline forecast. Growth in the latter half of the year
will likely come from business fixed investment and consumer services spending as both
commodity markets and fixed income markets settle into the post-pandemic central bank
tightening cycle.
IMPORTANT DISCLOSURES
This material is for general information only and is not intended to provide specific advice or recommendations for any individual. There is no assurance that the views or strategies discussed are suitable for all investors or will yield positive outcomes. Investing involves risks including possible loss of principal. Any economic forecasts set forth may not develop aspredicted and are subject to change.
References to markets, asset classes, and sectors are generally regarding the corresponding market index. Indexes are unmanaged statistical composites and cannot be invested into directly. Index performance is not indicative of the performance of any investment and does not reflect fees, expenses, or sales charges. All performance referenced is historical and is no guarantee of future results.
Any company names noted herein are for educational purposes only and not an indication of trading intent or a solicitation of their products or services. LPL Financial doesn’t provide research on individual equities.
All information is believed to be from reliable sources; however, LPL Financial makes no representation as to its completeness or accuracy.
U.S. Treasuries may be considered “safe haven” investments but do carry some degree of risk including interest rate, credit, and market risk. Bonds are subject to market and interest rate risk if sold prior to maturity.
Bond values will decline as interest rates rise and bonds are subject to availability and change in price.
The Standard & Poor’s 500 Index (S&P500) is a capitalization-weighted index of 500 stocks designed to measure performance of the broad domestic economy through changes in the aggregate market value of 500 stocks representing all major industries.
The PE ratio (price-to-earnings ratio) is a measure of the price paid for a share relative to the annual net income or profit earned by the firm per share. It is a financial ratio used for valuation: a higher PE ratio means that investors are paying more for each unit of net income, so the stock is more expensive compared to one with lower PE ratio.
Earnings per share (EPS) is the portion of a company’s profit allocated to each outstanding share of common stock. EPS serves as an indicator of a company’s profitability. Earnings per share is generally considered to be the single most important variable in determining a share’s price. It is also a major component used to calculate the price-to-earnings valuation ratio.
All index data from FactSet.
This research material has been prepared by LPL Financial LLC.
Securities and advisory services offered through LPL Financial (LPL), a registered investment advisor and broker-dealer (member FINRA/SIPC). Insurance products are offered through LPL or its licensed affiliates. To the extent you are receiving investment advice from a separately registered independent investment advisor that is not an LPL affiliate, please note LPL makes no representation with respect to
such entity.
Not Insured by FDIC/NCUA or Any Other Government Agency Not Bank/Credit Union Guaranteed
Not Bank/Credit Union Deposits or Obligations May Lose Value RES-1120754-0422 | For Public Use |
Tracking # 1-05266415 (Exp. 4/23)

