2022 was a dizzying year as markets and the global economy continued to find itself out of balance due to the still present aftereffects of the COVID-19 pandemic and the policy response to it. If 2022 was about recognizing imbalances that had built in the economy and starting to address them, we believe 2023 will be about setting ourselves up for what comes next as the economy and markets find their way back to steadier ground. The process of finding balance may continue to be challenging and we may even see a recession, but underlying fundamentals could create opportunities in stock and bond markets that were difficult to find in 2022
This commentary contains excerpts from LPL Research’s Outlook 2023: Finding Balance
OUTLOOK – ECONOMY
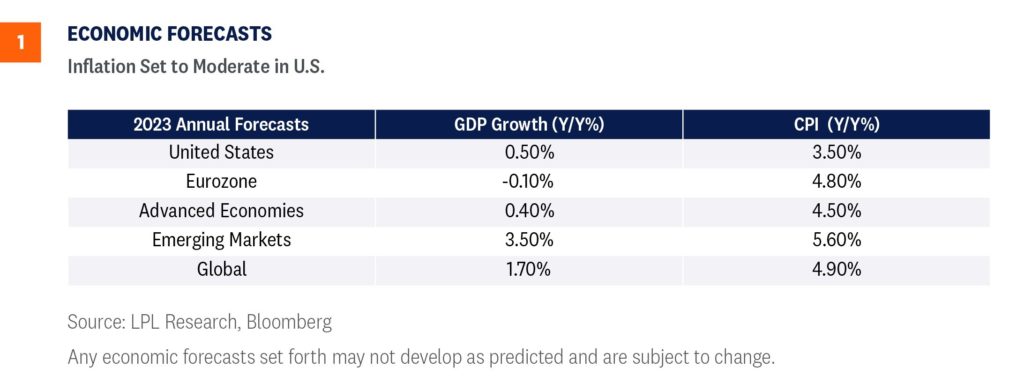
The global economy will likely slow from the upper-2% range in 2022 down to the mid-1% range in 2023 [Figure 1]. Much depends on China’s growth path now that it has largely abandoned its overzealous zero-COVID-19 policy. An important aspect for investors is that the U.S. appears to have fewer headwinds to growth compared with Europe and other developed economies. The divergence between the domestic and international economies is most obvious in the inflation regime. Germany, for example, is still experiencing accelerating rates of inflation, whereas the U.S. has likely moved past the peak. The longer inflation is uncontained, the riskier the growth prospects.
If the U.S. falls into recession, the chances are it would occur during the first half of 2023 and will not likely be as deep as the 2008 recession, which was initiated by a fundamentally flawed financial market.

MORE CLARITY ON POTENTIAL FOR U.S. RECESSION
One reason we’re currently seeing a healthy debate on the likelihood of a recession is that for most of 2022, not all of the metrics that typically precede recessions were flashing warning signs. However, recent data may give us more clarity. The Conference Board’s Leading Economic Index (LEI), an aggregate of indicators that tend to lead economic activity, is now in an extended decline, showing the economy could enter a period of significant and broad-based contraction. The decline is predictable as many sectors, such as housing, started slowing months ago. Since the inception of the LEI, a decline of the current magnitude over a sixmonth period has always foreshadowed a recession in subsequent quarters. As such, we think recession risks appear more probable by the beginning of 2023. If the economy does fall into a recession, the cause will likely be from the consumer sector retrenching after years of inflationary pressures, high housing costs, and slow real wage growth.
INFLATION SHOULD BECOME CONVINCINGLY SOFTER
Investors and central bankers will likely enter 2023 with a slightly different trajectory for inflation, particularly services inflation. In recent months, durable goods prices have clearly decelerated—and in some cases, outright declined—but services prices have been stubbornly accelerating as rent prices and health services rose. We could potentially be entering a new regime as rents across the country are showing signs of abating. During this transition period for services prices, the coming year could be the time when inflation is convincingly decelerating closer to the Federal Reserve’s (Fed) long-run target of 2%.
If inflation in 2022 was about supply constraints, then inflation in 2023 could center on demand constraints. For the past year, supply-related problems contributed more to inflation than demand-related imbalances. China’s zero-COVID-19 policy was one of the biggest glitches in supply chains, as metro areas and ports were shuttered by the Chinese government. However, things may be on the verge of changing as supply and demand get into balance throughout 2023, and as inflation likely becomes more demand driven and less supply driven. This is positive for policymakers because monetary policy tools do not work on supply shocks but rather, only on demand; thus, these tools are now more relevant than they were when inflation was primarily from supply bottlenecks. So as supply constraints ease and as Fed tools become more impactful, we could see the rate of inflation decelerating further in 2023.
OUTLOOK – STOCKS
Equity markets lacked balance in 2022 as the challenging macro environment overwhelmed business fundamentals. Stubbornly high inflation and sharply higher interest rates were the dominant market drivers, pressuring valuations and inciting fears of recession and falling corporate profits. In 2023, we look to equity markets to find a better balance between key macroeconomic factors—inflation, interest rates, and Fed policy—and business fundamentals.
REACHING THE PEAK OF THE RATE CLIMB
If stocks are going to go higher in 2023, a prompt end to the Fed’s rate hiking campaign will likely be a key component. Our base case is the Fed will pause in early spring of 2023 amid an improving inflation outlook and loosening job market. Should that occur, stocks would likely move higher, consistent with history. Stocks have tended to produce solid gains after hiking cycles end, including a 10% average gain one year later.
WHAT GOES DOWN TENDS TO GO UP
They say what goes up must come down. For the stock market, it also works the other way. Through many economic downturns, recessions, and geopolitical crises over many decades, the stock market has always recovered. Those patient and courageous investors who were able to take advantage of those declines have usually been rewarded nicely. Following down years, the S&P 500 Index (S&P 500) has risen an average of 15%, with positive returns in 15 out of 18 years. Since 1950, a down year was only followed by another down year three times: in 1973, 2000, and 2001.
Looking at this another way, after losing 20% or more at any point in time, the S&P 500 has gained an average of 17.6% over the subsequent 12 months (monthly data). The positive postmidterm election year pattern provides another historical analog that should be supportive of higher stock prices in 2023.
WIDE RANGE OF POSSIBLE EARNINGS OUTCOMES
Corporate America faces significant headwinds as 2023 gets underway. Cost pressures amid high inflation and still-snarled global supply chains are the biggest factors, but slowing economic growth and the strong U.S. dollar may make any earnings growth in 2023 difficult to achieve. Many companies over-earned during the pandemic, so some reversion back to normal still needs to occur. Inventories also need to be brought down. Even though some of these pressures have started to ease, lower commodity prices and slightly looser labor markets have, thus far, had limited impact on inflation overall.
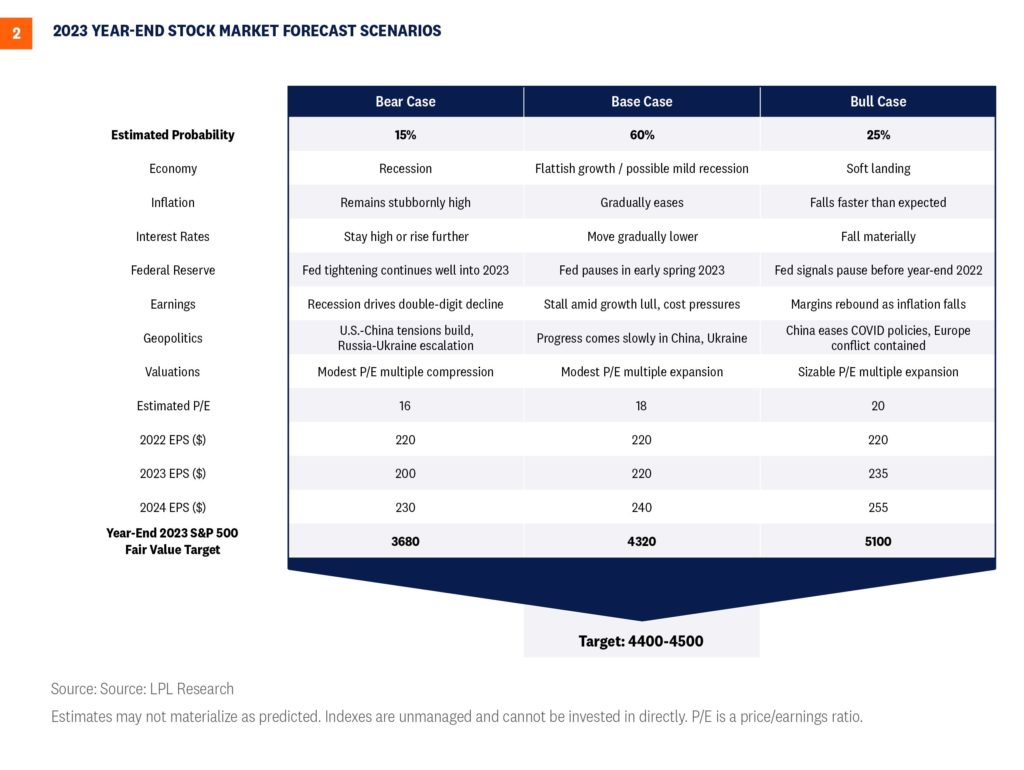
Our base case for S&P 500 earnings per share in 2023 is $220, similar to where 2022 is tracking and well below consensus ($230.66 as of December 29, 2022). Revenue will continue to get a boost from inflation, as many blue chip companies during third quarter earnings season demonstrated an ability to pass along higher prices due to their pricing power. But margins will likely compress further over the next several quarters before support from lower costs potentially arrives.
An upside scenario could materialize if inflation falls faster than we anticipate, propping up margins and potentially putting S&P 500 earnings per share as high as $235 in 2023 and over $250 in 2024. On the other hand, stubbornly high inflation and a more prolonged economic downturn could introduce downside risk, possibly down to $200 per share in earnings in 2023 before a potential rebound to $230 in 2024.
TILTING THE SCALES BACK IN FAVOR
In 2022, the bear market decline in stocks was all about the macro picture—high inflation, surging interest rates, and rising recession risks. Strong consumer and corporate balance sheets and growth in corporate profits were not rewarded by investors, who were focused on rising recession risk and concerns of higher interest rate levels affecting future earnings. Add to that a tense geopolitical landscape and a strong U.S. dollar, and stocks struggled to make any headway throughout the year.
Looking ahead to 2023, stock drivers are likely to be more balanced. Rather than the scales tilting toward rising interest rates and runaway inflation, we may see falling interest rates and lower inflation supporting higher stock valuations. Should the outlooks for economic growth and inflation improve as 2023 progresses, stocks may also get a lift from prospects for stronger earnings growth in 2024.
LPL Research’s Strategic and Tactical Asset Allocation Committee (STAAC) sees fair value for the S&P 500 at 4,400–4,500 at year-end 2023, based on a price-to-earnings ratio of 18–19 and $240 per share in S&P 500 earnings in 2024. That target is also derived from probability weighted scenarios and based on various paths for the economy, inflation, interest rates, and earnings [Figure 2].

We look for stocks to find better balance between the macro environment and business fundamentals in 2023, tilting the scales toward the bulls.
OUTLOOK – BONDS
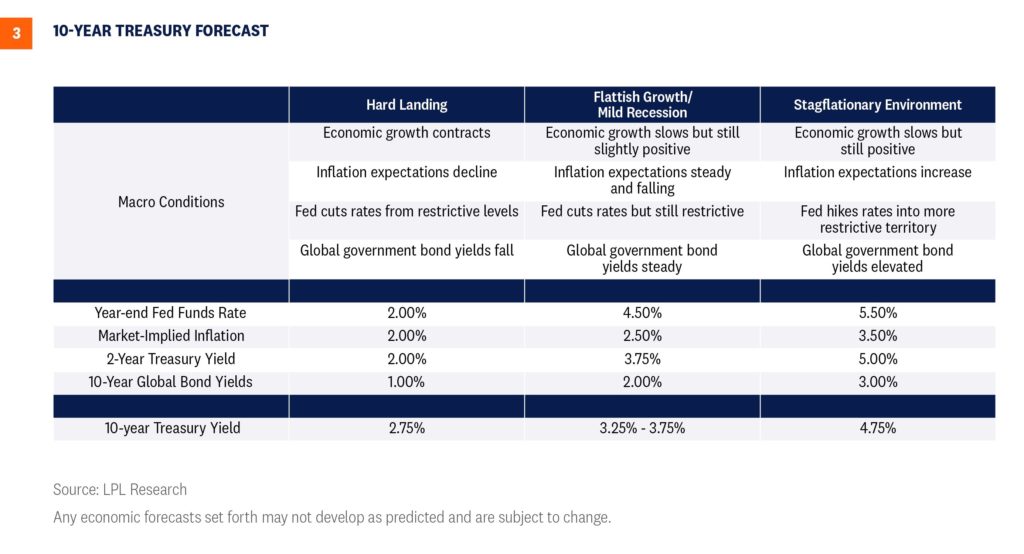
The path of interest rates in 2023 will largely be influenced by the Fed’s behavior, which will be guided by economic growth and inflation data. Equally important is the level of non-U.S. developed government bond yields, as foreign investors are an important buyer of U.S. Treasuries. Higher foreign market yields, all else equal, generally dissuade foreign investment into our markets. There are a range of scenarios we think could play out over the year. However, given our view that the U.S. economy could eke out slightly positive economic growth in 2023, we think 10-year Treasury yields could end the year around 3.5% [Figure 3].

THE ROAD TO RECOVERY FOR CORE BONDS
The core bond index (as defined by the Bloomberg Aggregate Bond Index) has seen losses in 2022 unlike any year since its inception. But because bonds are both financial instruments and financial obligations, which pay coupons and principal repayments at par when they mature, the potential for recovery is a bit more certain than in the equity markets that rely primarily on price appreciation. So, how long will it take to recover this year’s losses?
If interest rates don’t change at all, the best expectation for performance over the next year would be the index’s starting yield, which sat at approximately 4.7% on December 28. But if interest rates decline by 0.5%, the Bloomberg Aggregate Bond Index could return more than 8% over the next 12 months. Moreover, if interest rates move back into the low 3% range, the core bond index could return around 11% over the next year. Also, and importantly, given where starting yields are, if interest rates increase by another 1% from current levels, fixed income markets broadly could still generate positive returns over the next 12 months. Given the move higher in yields we have experienced this year, we think the risk/reward for owning core bonds has improved.
However, for investors that don’t want to take on a lot of interest rate risk, the opportunity set in shorter maturity fixed income securities has improved as well. With 1- and 2-year Treasury securities both yielding above 4%, cash and cash-like instruments finally offer an attractive yield. Moreover, shorter maturity investment grade corporate securities are offering yields in line with longer maturity corporate credit securities—without the same level of interest rate or credit risk.
One thing to consider is that because starting yields are the best predictor of future returns over the maturity of a fixed income instrument, by taking on that additional interest rate risk and owning a full market core bond portfolio, investors would be “locking in” investments at higher yields for a longer period of time. If interest rates do fall from current levels, investors that are in shorter maturity securities would then have to reinvest proceeds at lower rate levels.
So for investors with an investment time horizon greater than five years, a full market core bond portfolio may make sense. Otherwise, shorter maturity securities offer attractive yields as well. Bottom line, after the back-up in yields in 2022, there are a number of attractive fixed income opportunities again.
WHAT’S NEXT FOR CORPORATE CREDIT?
Since Treasury yields are generally used as the base rate for consumer and corporate borrowers, this year’s increase in Treasury yields pushed many borrower’s borrowing costs to levels not seen in years. For corporate borrowers, after years of borrowing at ultra-low rates, the backup in yields we’ve seen this year has pushed corporate borrowing rates back above 5%, which is meaningfully higher than the 2% levels many borrowers enjoyed in 2020 and 2021. Could higher borrowing costs for corporates reduce profitability and potential growth opportunities?
Perhaps, but over the last two years in particular, corporate borrowers have increased the amount of new debt issued seemingly to prepare for the rising rate environment we’re currently facing. In fact, new corporate debt issuance for investment grade companies hit record highs in 2020 and 2021, when over $3 trillion of new debt was issued. As such, corporate entities were able to term out debt by issuing a lot of debt at longer maturities and lower rates. Also, and notably, because companies were able to refinance existing debts over the last few years and push out maturities, only about 1% of existing debt needs to be refinanced in 2023, and less than 10% needs to be refinanced before 2025. So the need for companies to refinance existing debt at these higher levels seems to be currently muted.
That said, if the Fed is able to keep rates at these elevated levels, and as the need for corporate borrowers to access the capital markets increases, there’s no doubt corporate profitability will be negatively impacted by higher interest expenses. However, we don’t think it will happen in the near term.
IMPORTANT DISCLOSURES
This material is for general information only and is not intended to provide specific advice or recommendations for any individual. There is no assurance that the views or strategies discussed are suitable for all investors or will yield positive outcomes. Investing involves risks including possible loss of principal. Any economic forecasts set forth may not develop as predicted and are subject to change.
References to markets, asset classes, and sectors are generally regarding the corresponding market index. Indexes are unmanaged statistical composites and cannot be invested into directly. Index performance is not indicative of the performance of any investment and do not reflect fees, expenses, or sales charges. All performance referenced is historical and is no guarantee of future results.
Any company names noted herein are for educational purposes only and not an indication of trading intent or a solicitation of their products or services. LPL Financial doesn’t provide research on individual equities.
All information is believed to be from reliable sources; however, LPL Financial makes no representation as to its completeness or accuracy.
All investing involves risk, including possible loss of principal.
US Treasuries may be considered “safe haven” investments but do carry some degree of risk including interest rate, credit, and market risk. Bonds are subject to market and interest rate risk if sold prior to maturity. Bond values will decline as interest rates rise and bonds are subject to availability and change in price.
The Standard & Poor’s 500 Index (S&P500) is a capitalization-weighted index of 500 stocks designed to measure performance of the broad domestic economy through changes in the aggregate market value of 500 stocks representing all major industries.
The PE ratio (price-to-earnings ratio) is a measure of the price paid for a share relative to the annual net income or profit earned by the firm per share. It is a financial ratio used for valuation: a higher PE ratio means that investors are paying more for each unit of net income, so the stock is more expensive compared to one with lower PE ratio.
Earnings per share (EPS) is the portion of a company’s profit allocated to each outstanding share of common stock. EPS serves as an indicator of a company’s profitability. Earnings per share is generally considered to be the single most important variable in determining a share’s price. It is also a major component used to calculate the price-to-earnings valuation ratio.
All index data from Bloomberg.
This research material has been prepared by LPL Financial LLC.
Securities and advisory services offered through LPL Financial (LPL), a registered investment advisor and broker-dealer (member FINRA/SIPC). Insurance products are offered through LPL or its licensed affiliates. To the extent you are receiving investment advice from a separately registered independent investment advisor that is not an LPL affiliate, please note LPL makes no representation with respect to such entity.
| Not Insured by FDIC/NCUA or Any Other Government Agency | Not Bank/Credit Union Guaranteed |
| Not Bank/Credit Union Deposits or Obligations | May Lose Value |
RES-1379200-1222 | For Public Use | Tracking # 1-05353771 (Exp. 01/24)
For a list of descriptions of the indexes referenced in this publication, please visit our website at lplresearch.com/definitions.

